Local business websites often miss the mark when it comes to user experience. Visitors land on a page, scroll a little, maybe click once, then leave. You’re left guessing what went wrong. Standard analytics can’t show where people get stuck or what they’re looking for but not finding.
This is where heatmaps come in with a solution.
Heatmaps offer visual insight into user behavior, such as where they click, scroll, pause, or drop off. With this data, you don’t have to rely on assumptions. You get a clear picture of how people interact with your pages. That’s crucial when you’re trying to create a better experience for users in a specific area.
In this guide, we’ll break down what heatmaps are and how to use them to improve your local page experience. If you’re focused on building a comprehensive local SEO strategy, understanding user behavior with heatmaps is a smart step forward.
Understanding Heatmaps and Their Different Types for Website Analysis
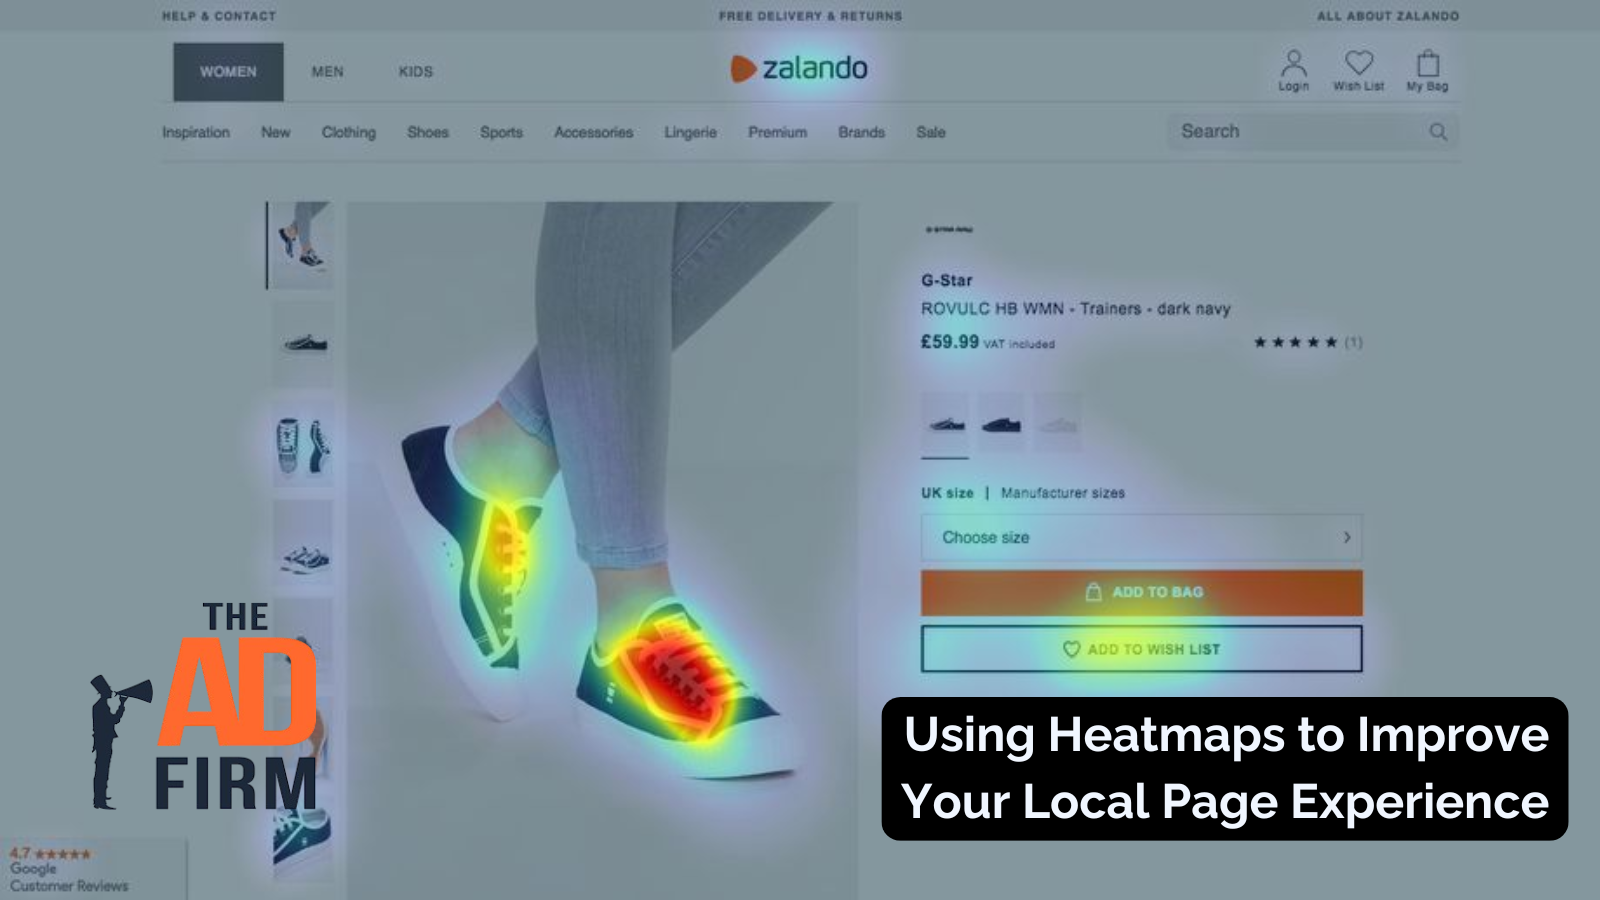
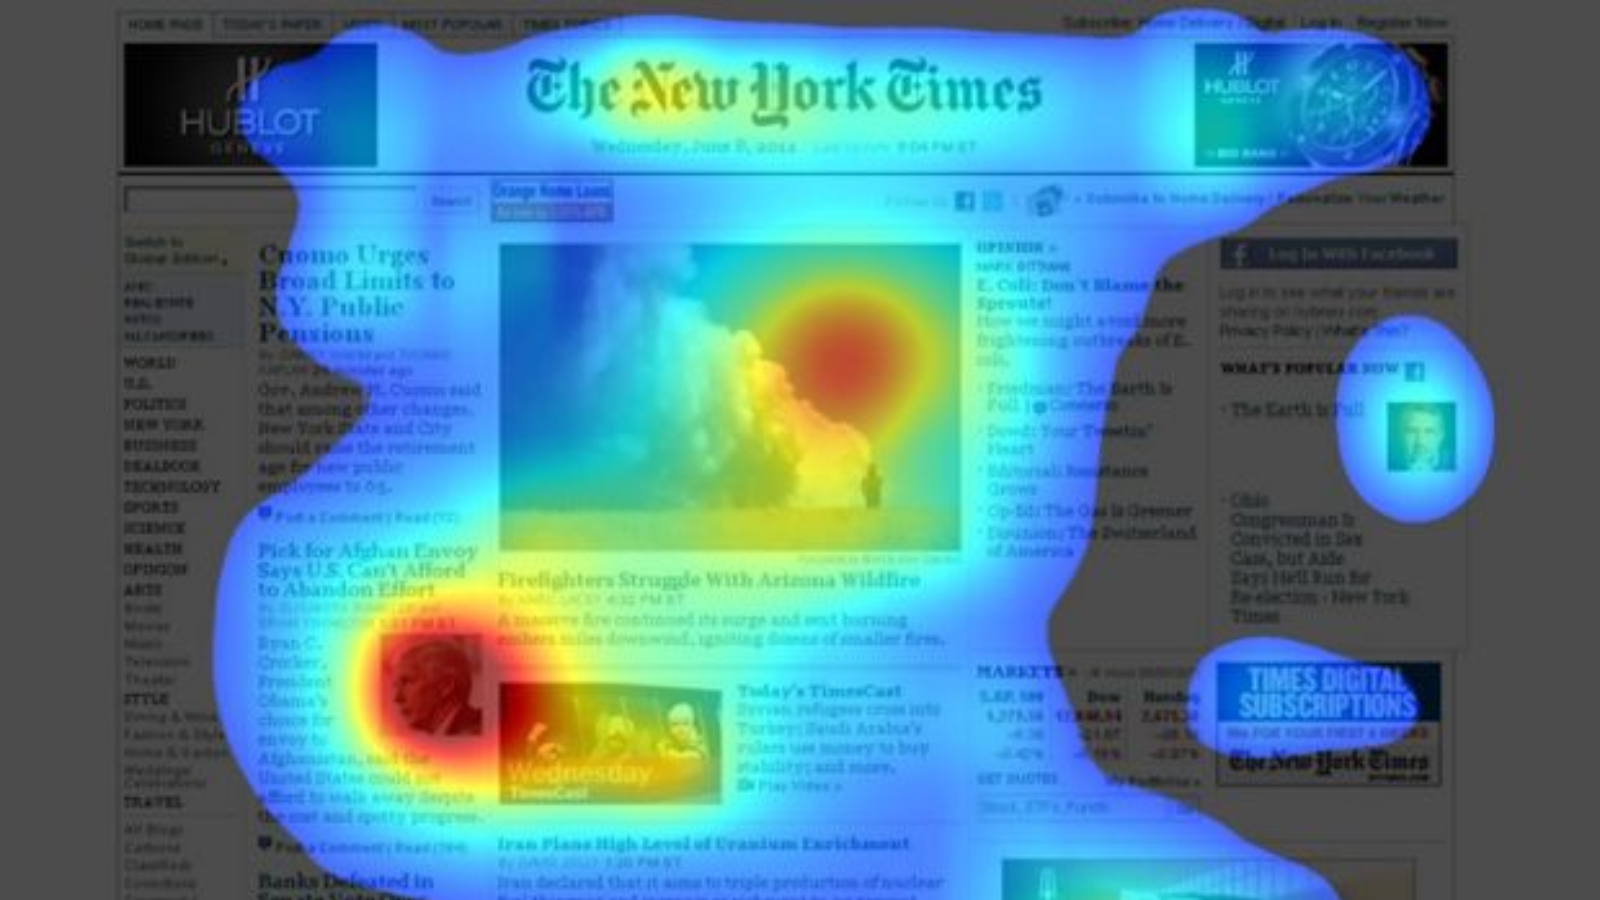
A heatmap is a visual report that highlights how users interact with your website. Instead of reading rows of numbers in a dashboard, you get a color-coded overlay of your actual page. The “hot” areas represent high activity, and the “cold” spots show where users largely ignore.
There are different types of heatmaps, each designed to track a specific kind of behavior:
- Click Maps: Show where users click or tap the most
- Scroll Maps: Visualize how far down a page users scroll
- Move Maps: Track where users move their cursor or hover
- Tap Maps (for mobile): Record taps and screen interactions on mobile devices
Each type gives you a layer of insight. Click maps reveal action. Scroll maps uncover visibility issues. Moving maps highlight interest patterns. Together, they help you understand how visitors experience your pages.
Why Heatmaps Are Essential for Local Business Website Success
Local users interact with websites in ways that don’t always show up in standard analytics tools. Heatmaps capture those subtle behaviors and make it easier to adjust your pages based on real user activity.
Let’s explore what heatmaps can uncover when it comes to your local visitors.
Revealing Hidden User Behavior Patterns That Analytics Miss
Analytics tools track actions like pageviews or session time, but they don’t show what happens between the clicks. A heatmap captures cursor movement, scrolling, and tap behavior that usually goes unnoticed. It shows if visitors click elements that aren’t clickable or if they skip over areas you thought were important.
This kind of visual feedback reveals gaps in your design. You might find that users consistently interact with non-interactive content or ignore your primary call-to-action. These insights help you make small but critical adjustments. Heatmaps surface the behavior that numbers alone can’t explain.
Understanding How Local Customers Navigate Your Website
Local visitors typically visit your site looking for something specific: hours, services, directions, or pricing. Heatmaps reveal how they move from your homepage to these key sections. You’ll see if they’re getting stuck or following an expected path.
If most traffic comes through location-based search or local ads, the heatmap will tell you how those users interact differently. This helps you optimize entry points and reduce friction. You can simplify paths and make key details easier to find. That improves both experience and retention.
Identifying Conversion Bottlenecks on Your Local Pages
Heatmaps help you pinpoint where users lose interest before converting. Maybe they scroll halfway through a page and leave. Maybe they click but abandon the form. These are signs of conversion friction.
Instead of guessing, you can test layout changes and watch how behavior shifts. Move your CTA closer to where users linger. Clean up clutter near decision points. For businesses already investing in local SEO automation, heatmaps help fine-tune where automation stops and real user interaction begins.
Making Data-Driven Decisions to Improve User Experience
Without heatmaps, many design changes are made on assumptions. With them, you can validate what users pay attention to. You no longer have to guess where attention goes.
If users ignore certain sections, reduce or reposition them. If they engage heavily in an unexpected area, make that content easier to access. Every design choice becomes intentional. That’s how you build with clarity and purpose.
How to Use Heatmaps to Transform Your Local Page Experience

Now that we know what heatmaps show, it’s time to put that insight to work. These steps focus on using heatmap data to make real, measurable improvements to your local pages.
Here’s how to get started and where to focus first:
Setting Up Heatmap Tracking on Your Most Important Local Pages
Focus first on the pages that drive conversions or bring in high-intent traffic. This usually includes location landing pages, service pages with strong search visibility, and your contact or booking pages. Start tracking those with a heatmap tool that supports session filtering by device and referral source.
Configure tracking to run separately for mobile and desktop. Local users often come from mobile devices, so capturing that behavior is critical. If you’re using Google Business Profile or running local ads, tag those visitors so you can isolate how they interact differently.
Let the heatmap run until you’ve gathered at least 300–500 sessions per page. This gives you enough data to identify clear behavior patterns. Then, begin analyzing where users engage, stop, or miss key actions.
Analyzing Click Patterns to Optimize Call-to-Action Placement
After gathering click data, check if your CTAs are getting ignored. If they’re sitting in cold zones, they likely need repositioning. Move them closer to high-click areas or section transitions where users are already paying attention.
Check if users are clicking other elements, such as images, icons, or headings, that aren’t linked. That’s a sign they expect interaction. Turn those into actionable elements where appropriate or redesign them to avoid confusion.
Also, evaluate the language and design of your CTA. Is it clear and action-driven? Is the button size mobile-friendly? Based on click data, test small variations one at a time and recheck performance with updated heatmaps.
Using Scroll Data to Restructure Content for Better Engagement
Scroll heatmaps reveal where users drop off and which parts of your page they actually see. If important info like pricing, services, or location is below the average scroll depth, move it up the page. Make sure the top section earns attention with a strong headline and clear value.
Break longer sections into smaller blocks with clear subheadings. Add visual cues like icons or imagery to guide readers downward. If users consistently stop before key content, test repositioning it earlier or summarizing it higher up.
You can also use scroll data to decide where to place testimonials, FAQs, or contact prompts. Don’t assume users reach the bottom of the page. Put high-impact elements where most of your audience actually spends time.
Leveraging Movement Patterns to Improve Navigation and Layout
Mouse movement and hover maps show where users focus attention, even if they don’t click. Look for spots where people linger but don’t act. That may mean they’re interested but confused about what to do next.
Use that insight to tweak your visual hierarchy. Emphasize key headlines, make buttons more noticeable, or reorder sections for a smoother flow. If users hover near your menu but never click, it could mean that the labeling or structure needs revision.
For local businesses working with a digital marketing agency, this kind of heatmap data improves layout decisions across multiple locations. You can apply these adjustments consistently while still tailoring them to what each audience needs most.
Implementing Mobile-Specific Improvements Based on Heatmap Insights
Mobile heatmaps are essential because mobile users engage differently. Review tap maps to see which elements get attention and which are skipped. If forms, CTAs, or menus require too much effort to reach or tap, that friction lowers conversions.
Start by simplifying your mobile layout. Use larger buttons, shorten forms, and place key info above the fold. Make navigation sticky or collapsible if users struggle to scroll or tap through multiple sections.
Once you adjust the layout, run another round of mobile-specific heatmap tracking. Check if taps improve on CTAs, bounce rate drops, or time on page increases. This iterative process ensures your local site performs smoothly across all devices.
Key Takeaway
Heatmaps give you a practical way to see how real people interact with your local website pages. Instead of relying on broad metrics, you get a detailed view of clicks, scrolls, and movement that reveals how users experience your content. This insight helps you make smarter, data-backed design decisions that match user behavior.
If you’re serious about improving your local page experience, heatmaps should be part of your regular workflow. They help you uncover missed clicks, poor content placement, and gaps in mobile usability. The value comes from acting on these patterns consistently, not just viewing them once and moving on.
You don’t need to overhaul your site to get results. Small layout changes, better CTA positioning, or mobile-specific updates based on heatmap insights can make a noticeable difference.
Keep testing, adjusting, and using this feedback to make your site easier to use and more effective for your local audience.